Data Automation
The Open Data Policy aimed to make City data more accessible by publishing it on an Open Data Portal. Doing so allows residents and City staff to get access to data without having to make a formal request. However, the Open Data Policy identified other goals, including making the City more transparent and publicly accountable and creating opportunities to improve City operations and quality of life through innovative, data-driven solutions. To achieve these goals, the data on the portal must be reliable and timely. This is where automation comes in.
Automated data extraction guarantees the data is transformed exactly the same way every time and is initiated on a regular schedule, as often as daily in some cases. Asking colleagues throughout the City to be responsible for manually updating data unnecessarily adds to their workload and subjects the data to the risk of human error. Additionally, the data automation system the Data & Analytics team built can send alerts and supports prediction and other advanced analytics the City hopes to undertake in the future. The Data team’s philosophy has always been to let machines do what they do best - updating data, running reports over and over, and keeping track of things - and humans do what they do best - making those fuzzy decisions that only brains can make.
The initial approach to automation
To get ready for the launch of the portal last year, Data & Analytics used a piece of software, SafeFME, for most ETL work. ETL - or Extract, Transform, Load - describes the three phases of getting data from one or more sources and sending it to another place. SafeFME came with the portal product the City had purchased from a vendor and had an easy-to-use graphical interface. The data team could avoid writing code most of the time, which significantly sped up the process for the initial portal launch. FME handled some tasks really well, but for other tasks, like downloading files according to a pattern from an FTP site, the team had to use other methods. The software also lacked two important parts of automation: scheduling and seamless upload to the cloud storage for the portal.
When it came time to tackle the scheduling aspect of automation, the Data & Analytics team realized it needed a flexible and extensible solution that could scale across the entire City, and so it made sense to take another approach.
Poseidon automation
To deploy automation, Data & Analytics turned to an open source project called Airflow. Airflow has become the tool of choice for Spotify, Lyft, AirBnB and many others. The City of San Diego is the first government organization to successfully deploy Airflow into production. Airflow has several advantages:
- Built in Python - so it’s extensible with any of thousands of Python open-source packages, like pandas, numpy and scikit-learn. More importantly, Data & Analytics team can use this extensibility to be able to connect to the wide variety of different systems scattered across the City.
- Modular - new connections to different data sources, from a shared drive to a relational database, are easy to write. For example, when the data team needs a connector to a system running technology X, there’s already a lot of existing code to create the connector to that type of system. This also lets us quickly pinpoint and fix bugs and failure points without compromising overall system stability.
- Open source with a strong community - so there’s plenty of support and continuous updates.
- Scalable - as the City needs to do more and more, Airflow easily scales.
The City’s implementation of Airflow is nicknamed Poseidon. The basic idea of Poseidon is this:
- Get data from a source (database, spreadsheet, map, website)
- Do some cool nerdy stuff to it (geocode it, aggregate it, clean it)
- Upload it (put it on the cloud that is backing the portal and a variety of other applications)
- Run it on a schedule (once every 5 minutes, OR once every day, OR on every odd day of the month at 3:02 PM)
To illustrate the steps listed above, here's an example DAG (Directed Acyclic Graph, or a set of tasks that have to be run in a non-linear sequence):
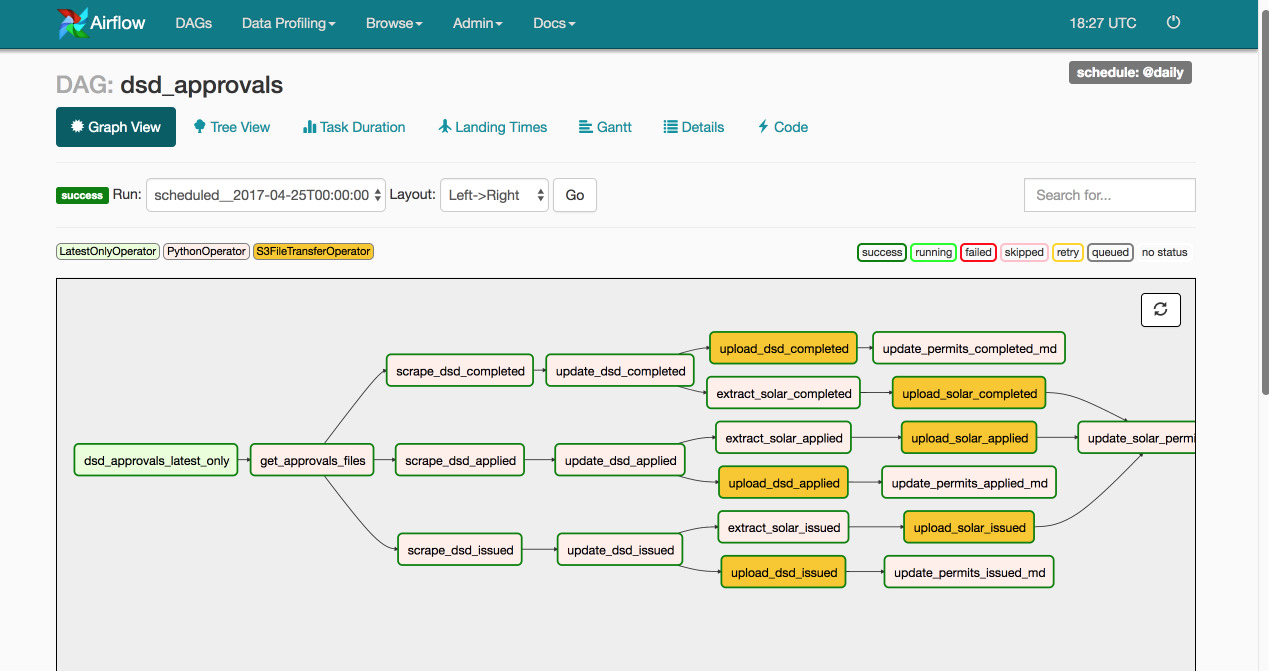
This DAG has the following steps:
- Get the latest DSD Approvals in Zip form
- Unzip them
- Since the files are separated into completed, applied, and issued, perform the following operations on each of the files:
- Traverse the resulting file, hitting the API endpoint for each approval, to collect more information for it
- Process the incoming information for each approval
- Merge with the existing base data
- Upload the file
- Extract solar data subset
- Upload solar subset
- Update the metadata on the portal
This is a massively time consuming task if done manually. However, it now runs every day without us having to think about it. And it runs correctly every time. If an error or warning occurs, the system generates an alert email.
Data & Analytics is now doing this for all dataset updates, which was a massive project over the last fiscal year. With dataset updates automated, everything built on top of the data, including StreetsSD and other visualizations, are also automatically updated. Each dataset page displays the date that particular dataset was last updated.
Alerting
The diagram above illustrates dependent pieces that run in a defined cycle. By flipping out and redefining some of those pieces, you get this:
Automated data is starting to get more interesting. Because of Poseidon’s flexibility, and the fact that it boils down to just a bunch of coordinated tasks, Performance & Analytics envisions a future where City staff can request and receive notifications, alerts based on thresholds, and all kinds of other real-time operational information that is only possible because of automation.