Customized Portal
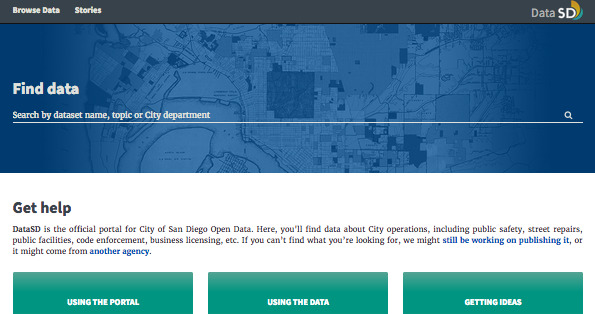
The City initially launched the data portal by buying a ready-made portal product from a company. As the Data & Analytics team was newer, this made the most sense, and the vendor‘s portal filled the City’s need at the time. The vendor portal allowed users to browse, search and filter the City’s dataset catalog, and it complied with the federal standards governments should follow when publishing data.
But a long-term vision for Open Data relies on high-tech strategies, most importantly automated data updates. Ready-made portal products are more compatible with a manual update process. For example, a customer of the portal vendor would upload a dataset to the vendor’s cloud using an upload interface. That dataset would then be available for download, for preview in the browser, and through a data application programming interface, or API. Some open data programs in other cities do depend on employees to upload data manually. This is because open data became a more common government policy long after governments had to make decisions about which technologies to use for data collection and management.
The Data & Analytics team built an alternative process for updating data that relied on code to upload data to its own cloud storage. To learn more about this robust automation system, see Chapter 5. The team could have gone a step further and scripted a connection between the City’s cloud storage and the portal product, but it would have taken extra work and potentially cost vendor fees and the effort would have been hampered by the fact that the City doesn’t have control over a product made by an outside company. In the future, as the vendor would upgrade its product, the City’s script might have broken over and over again.
A portal created in-house that worked perfectly with the automation process was the obvious solution, especially because the data team had the technical skill to create one. All a website needs to become a data portal is a page with a list of datasets - the catalog - and individual pages for each dataset that contain links to download the data. P&A also wanted more control over the design and functionality of the portal, but adding functionality and features to a vendor product would end up costing taxpayers money that could be better spent.
New portal, new features

Blog
A data story is a concept the previous data portal introduced. These stories put City data into maps and charts and allow City staff to write accompanying text that provides context. A data story is a good way to provide ideas on what’s possible with data or to show overall trends to people who may not want to spend time downloading and analyzing a large dataset.
The new portal still has data stories, but the Data & Analytics team is also publishing how-to articles and features in the same place.
Faster load times
The first data portal was powered on the back-end by a content management system (CMS). A CMS is convenient for multiple people to collaborate on creating content for a website, such as staff in various City departments who are responsible for updating their respective webpages. Staff can upload or write content through a user interface that requires minimal technical skill. Content pieces live in a database and are pulled together into a webpage when a user loads the website. Websites managed this way might load more slowly as content is extracted from the database. To get around slow load times, some websites use caching to save a webpage and display the saved version instead of refreshing it every time. This can result in delays for users to get a fresh version of a webpage.
The Data & Analytics team took a different approach with its custom data portal. The team uses Github for collaboration. Github houses the codebase for the data portal and allows team members to pull the code down, update it, and integrate changes back into the main codebase.
The codebase itself is a static HTML site. All content exists within HTML markup and loads quickly. Static sites can become time-consuming to update and normally require a person to be able to write HTML code. To avoid unnecessary time waste, Data & Analytics uses a tool called Jekyll. Jekyll has a specific file structure for different types of content and compiles content to build a static copy of a website. The data team can use Markdown for blocks of text, includes for things like headers and footers, and data files for things like the list of City departments that populates a menu in a sidebar. When the portal needs an update, the team runs Jekyll, and a new static copy of the website is created. With automatically updated data, the data team could not have a portal that required regular manual updates, so it scripted a solution that runs Jekyll on a schedule without human intervention. This is necessary for updating the last-modified dates for datasets.
More control over design
With control over the content and design of the portal, P&A can collect usage data, conduct user testing, and otherwise get feedback to improve its design and functionality. The Data & Analytics team keeps a list of improvements in the Github repo, prioritizes these improvements, and completes the work in short bursts, or sprints.
Some of the improvements on the list for FY18 include:
- Expanding data preview options beyond the simple rows-and-columns view that is currently available on each dataset page to include maps and charts where applicable
- Giving users the ability to create a chart on a dataset page without having to download the data, and offering summary metrics about the data at the top of the dataset page
- Reorganizing geospatial data from a generic category of “GIS” (Geographic Information Systems) to other topical categories that will be more relevant
- Adding a page with portal and dataset usage numbers